
Viz: Covid Map Visualization
The scale of the Covid-19 pandemic is hard to grasp.
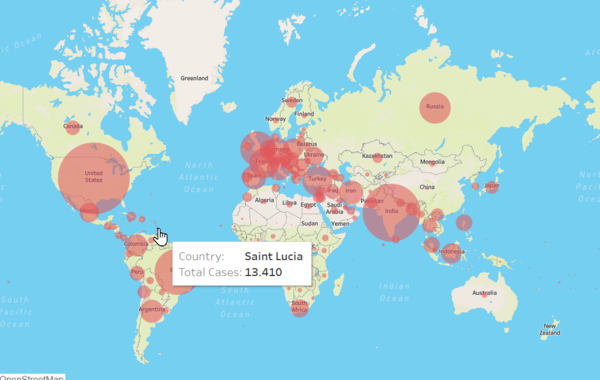
I created an interactive map using Tableau to show the number of Covid-19 cases.
It’s like a digital map that lets you click around and see how many cases there are in different places.
This way, it’s easy to make sense of the pandemic’s impact.